Articles
The Gann Quarterly Chart By Jerry Favors
INTRO
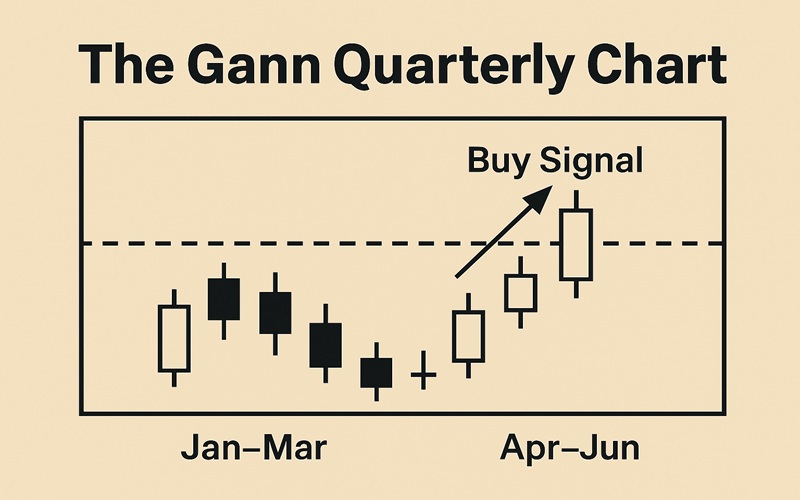
The Gann quarterly chart, a long-term indicator, will signal a turn up from any bear market low when the Dow Jones Industrial Average (DJIA) rallies above the intraday high of the prior quarter. Until the DJIA falls below the intraday low of the previous quarter, the trend remains up. However, the trend turns down when the DJIA falls below the low of the previous quarter. Those quarters run the traditional schedule: January to March, April to June, July to September and October to December.
As each new quarter begins, for the Gann quarterly chart to be most effective it is necessary to keep track of the intraday high and low of the previous quarter. When prices rally above the prior quarter’s high, they normally go significantly higher before a major top is reached. The converse is also true in that when prices fall below the intraday low of a previous quarter, they normally go significantly lower before a major bottom is reached. This technique is very effective. W.D. Gann stated that upturns or downturns in this chart often signaled the onset of new bull or bear markets.
Figure 1 shows every quarterly chart upturn or downturn since 1980. Notice that each upturn or downturn in the last 10 years led to what would be labeled a new bull or bear market. For instance, the DJIA experienced a major low on March 27, 1980.
Second-quarter 1980 began on Tuesday, April 1. For the quarterly chart to signal a turn up, the DJIA in the second quarter needed to rally above the intraday high of the previous quarter. The intraday high of first-quarter 1980 was the 918.17 high seen on February 13. The DJIA failed to exceed that level by the end of second-quarter 1980, so the chart did not show a turn up.
THE THIRD QUARTER
Third-quarter 1980 began on Tuesday, July 1. For the chart to show a turn up in the third quarter, the D JIA had to rally above the intraday high of the second quarter, or the 896.33 intraday high of June 26, 1980. That occurred on July 7, 1980, at 896.34 intraday, and the quarterly chart turned up from there (point A on Figure 1). The bull market continued up 134 points more, or up 15%, to a bull market high of 1030 on April 27, 1981. The quarterly chart then turned down at 923.89 intraday on July 2, 1981 (point B). The bear market persisted, ultimately carrying prices down a further 154 points, or 17%, from the point at which the chart turned down.
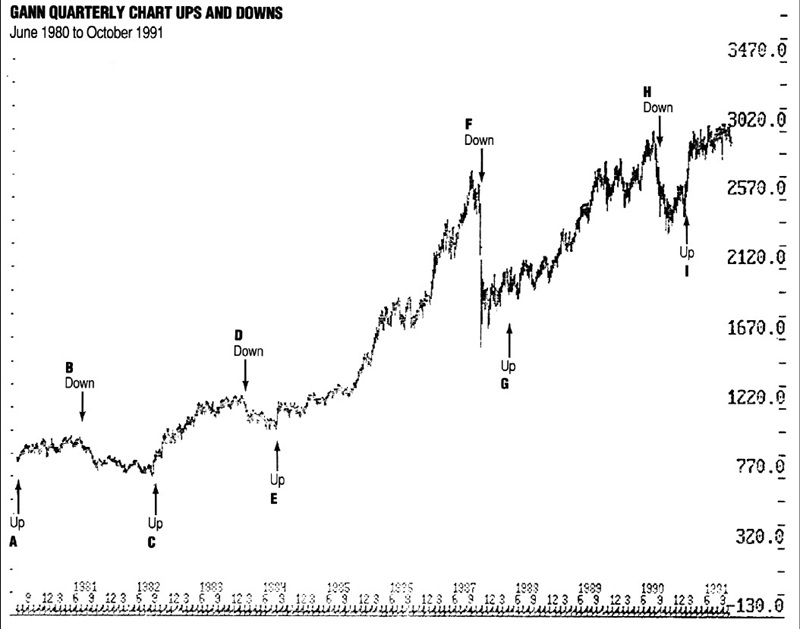
FIGURE 1. Here is the weekly chart of the DJIA with the quarterly buy and sell signals placed. A buy signal occurs if the DJIA surpasses the previous quarterly intraday high. A sell signal occurs if the DJIA moves below the previous quarter’s intraday low.
The bear market bottomed on August 9, 1982, at 769 intraday. The quarterly chart then turned up on August 23, 1982, at 876.52 intraday (point C) in the DJIA. That leg of the bull market continued up a further 420 points, or 47.9%, from the point at which the quarterly chart turned up. The quarterly chart did not turn down during this time frame between August 23, 1982, to November 30, 1983. The quarterly chart then turned down on February 1, 1984, at 1209.33 intraday (point D). Here, too, a bear market followed, with prices continuing down 131 points, or a further 10.8%, after the signal was given. The quarterly chart turned up on August 3, 1984, at 1194.41 intraday. This confirmed that the next bull market leg up was under way.
The DJIA continued down a further 283 points intraday, or 10.7%, before bottoming at 2344 on October 11, 1990.
In point of fact, the bull market continued higher by an additional 1,552 points, or up 129%, after the signal was given. Here again, the quarterly chart never once turned down throughout the entire 1984 to August 1987 bull market. The quarterly chart then turned down on October 15, 1987 (point F), at 2391.25 intraday. This was, of course, followed by the 1987 crash the following Monday.
📖 Learn Gann’s Techniques – Suggested Reads


FURTHER COLLAPSE
While the ensuing decline was brief in terms of time, the DJIA still collapsed a further 775 points, or down 32.4%, from the 2391.25 intraday level at which the quarterly chart turned down. The quarterly chart then turned back up on April 12, 1988, at 2110.92 intraday (point G). Here again, the quarterly chart continued to point straight up from April 12, 1988, all the way up to the 3025 intraday high of July 17, 1990. The DJIA rallied 915 points, or up 43.3%, after the chart turned up — another very impressive signal. But ultimately the quarterly chart turned down on August 17, 1990 (point H), at 2627.69 intraday.
The DJIA continued down a further 283 points intraday, or 10.7%, before bottoming at 2344 on October 11, 1990. The quarterly chart turned up on January 18, 1991, at 2662.63 intraday. So far the DJIA has continued up 429 points, or up 16.1 %, to a high of 3071 intraday in November 1991, as of this writing.
Each up- or downturn in this entire 11-year period led to what most traders would label a bull or bear market. According to previous trends, the quarterly chart should turn down between October 1 and December 31, 1991, on any decline below 2836.31 intraday in the DJIA.
IN COMING MONTHS
Finally, it is normally true that the DJIA will reach a short-term high or low within one to three days after any up- or downturn in the quarterly chart. If 2836.31 intraday is broken, we should expect a short-term low within one to three days, and then an oversold rally attempt, which may last anywhere from a few days to a few weeks. Afterward, an even more severe decline to new lows should follow and most likely a major bear market.
Longtime newsletter publisher Jerry Favors introduces a long-term indicator called the Gann quarterly chart, which will signal a turn up from bear market lows when the Dow Jones Industrial Average (DJIA) rallies above the high reached in the previous quarter during the trading day and not the high reached at the close of the trading day, which is more customary. Bear markets occur when the previous quarter’s intraday low is breached. This technique requires careful monitoring of the intraday highs and lows of the previous quarter. Favors points out that W.D. Gann, who invented this particular technique, said that the upturns or downturns in this chart often signaled the onset of new bull or bear markets.