Articles
Gann Weekly Swing Chart By Jerry Favors
One of the methods that W.D. Gann used to determine and trade the main trend of stocks and commodities was what are commonly referred to as swing charts. These swing charts cover varying degrees of time spans ranging from hourly charts to yearly charts. Each of the Gann swing charts turns up or down based on specific rules. The longer the time span covered by any swing chart, the stronger and more important are the signals given to me. For instance, a buy or sell signal from a weekly swing chart would be stronger and more important than a buy or sell signal from a daily swing chart but not as strong or as important as the signals from a monthly swing chart.
While many of Gann’s other techniques and methods of trading have been explained in detail by others, one area that has not been examined or explained in depth is the use and interpretation of these swing charts. I utilize more than 20 different Gann swing charts on a daily basis, each turning up and down on differing sets of rules. I am often asked, “If you had to use only one swing chart in your day-to-day trading, which would you use?” This is always a difficult question to answer, because it has been my experience that each of the various swing charts tells you something different about the stock or index in question. The overall picture does not become clear until every signal from all the various charts has been gathered and summed. To skip even one of these swing charts is to risk missing or overlooking a potentially important piece of the puzzle. However, when I can choose only one chart, the Gann weekly swing chart is the one.
WEEKLY SWING CHART DETAILS
The weekly swing chart will turn up from any extreme low price when the stock in question rises above the highest price seen in the prior week. The chart will then continue higher to the highest price reached before the stock falls below the lowest price seen in any prior week, which then turns the chart down. Figure 1 is a weekly chart of House of Fabrics (HF) from April 30, 1991, to May 15,1992. HF reached a high of 41 -1/2 On October 30, 1991. Now walk through the process of constructing the weekly chart from that point. Prior to the 41-1/2 top on October 30, 1991, the weekly chart had pointed up from the 36-1/2 low on October 28, 1991. Here is the high, low and closing price for HF for the week of October 28, 1991, to November 15, 1991:
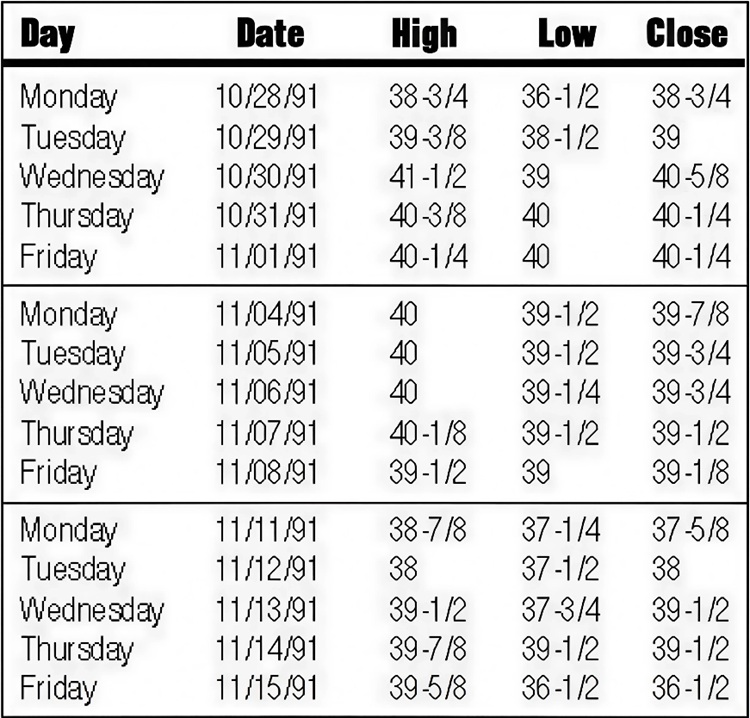
It is important to remember that the weekly chart will turn down from any high when the stock falls below the lowest price seen in any prior week. Beginning the week of November 4, any decline below the lowest price seen the week of October 28, 1991, would turn the chart down. The lowest price seen that week was 36-1/2, seen on October 28. Any decline below that level after November 1 would then turn the weekly chart down. The lowest price seen the week of November 4 to November 8 was 39-1/8, so the weekly chart did not turn down that week.
Beginning the next week, November 11 to November 15, the weekly swing chart would then turn down on any decline below the lowest price seen in the prior week of November 4 to November 8, or 39. HF fell below 39 on November 11, and the weekly chart turned down from that point. Once the chart turns down, draw a horizontal line representing the prior high and place that price high of 41-1/2 just above the bar along with the date of the high, October 30, 1991. Once the chart turns down it continues to point down to the lowest price reached before the stock rallies above the high of any prior week. For instance, after the chart turned down on November 11, HF would have had to exceed the highest price seen in a prior week (November 4 to November 8) of 40-1/8 to turn the weekly chart back up. Keep in mind this would have to occur the same week (November 11 to November 15) for the weekly chart to turn up on a move above 40-1/8. Note the highest price reached the week of November 1 1 to November 15 was 39-7/8, seen on Thursday, November 14. Therefore, the weekly chart did not turn up that week. The next week, or November 18 to November 22, HF would have to exceed the high of the prior week (39-7/8 seen on November 14) to turn the weekly chart back up.
In fact, HF failed to exceed the high of a prior week all the way down to the 22-3/4 low of December 11. The weekly chart did not turn up until December 30 when 29-1/4 (the highest price seen the week of December 23 to December 27) was exceeded. Once the stock reaches a low and the weekly chart turns up, draw a horizontal line across where that low would be and place under it the low price and the date that it was reached. We then turn our line back up.
🔍 Master Gann’s Tools – Recommended Ebooks
UTILIZING THE TECHNIQUE
This describes the basic rules governing how the weekly chart turns up or down. Remember that it is always the highest or lowest price seen in the prior week that turns the weekly chart’s direction. Now how do we actually utilize this technique in stock trading?
The overriding concern of the trader is the main trend of any tradeable he or she is trading. The weekly swing chart’s purpose is to identify and keep you with the main trend, whether it is up or down. If the main trend is up, the stock will trace out a pattern of higher bottoms and higher tops, in that order. Keep in mind an uptrend is not higher tops and higher bottoms, but higher bottoms and higher tops, which are not synonymous. If the main trend is up, any decline below a prior swing chart bottom is a signal of lower prices (at least short term) and a potential change in trend from up to down. If the main trend is down, the swing chart will trace out a pattern of lower tops and lower bottoms and in that order. When the trend is down, any rally above a prior swing chart high is a signal of higher prices, at least short term, and a potential change in trend. If the main trend is up, showing higher bottoms and higher tops, you will remain long in the stock in question and keep raising your stop to each higher swing-chart bottom.
The first time the stock falls below a prior swing chart bottom, you will sell long positions and go short, with a stop then placed just above the prior swing chart top. If the trend continues down, you will keep lowering your stop to just above each successively lower top. Now let’s just walk through an example of what we mean by studying each signal on HF on Figure 1.
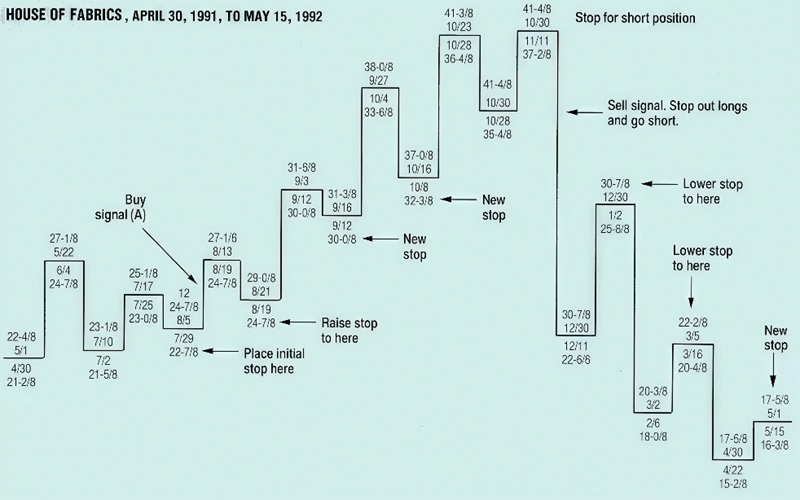
FIGURE 1: The weekly swing chart is a trend-following method designed to position the trader with the main trend.
THE FIRST SIGNAL
The first signal to take action on this chart was at point A, when the prior swing high of 25-1/8 on July 17 was exceeded on August 6, 1991. We would then go long with a stop place just below the prior low of 22-7/8. If we had purchased HF the day the signal was given, the highest price we could have paid was 25-1/4, which was the high for the day. After the buy signal on August 6, HF continued up to a high of 27-1/8 on August 13,1991.
HF then pulled back to a low of 24-7/8 on August 19. The weekly chart actually turned down on August 19, when HF fell below the prior week’s low of 25-3/4. Note that the 24-7/8 low of August 19 was above our prior stop of 22-3/4, so we remained long. After the August 19th low of 24-7/8, the weekly chart turned back up on August 21 when the prior week’s high of 27-1/8 was exceeded. Since our rule is to always place our stop for long positions just under each prior weekly chart swing bottom, we will now raise our stop from 22-3/4 to 24-3/4 (just under the August 19th low).
In this same manner, we will keep raising our stop to each higher bottom as indicated. Note that the chart would have put you long near 25- 1/4 and would have kept you long all the way to the 41-1/2 high on October 30, 1991. You would then have been stopped out of your long positions on the break of the prior low at 36-1/2, which occurred on November 19,1991. Since the rules state to reverse position anytime we are stopped out, we would not only sell long positions when HF fell below 36 1/2 but would also now go short with our stop just above the prior high of 41-1/2. We would keep lowering our stop to each lower top as indicated on Figure 1.
If we review our trades now from August 5,1991, to May 15, 1992, we find that we would have gone long near 25-1/4 (on August 6) and stopped out near 36-1/2 on November 19,1991. Even if we assume the worst possible execution price on November 19 we would still have sold long positions at 34-3/4. Therefore, we would have a worst-case gain near 9-3/8 point minus commissions. We would then go short on November 19 on the break at 36-1/2. Once again, if we assume a worst-case fill, we should have been short near 34-7/8 on November 191. As of this writing on May 15, 1992, so far HF has reached a low of 15-1/4 on April 22.
That worst-case execution of 34-7/8 for our short sale would have shown a paper profit of 19-5/8 or 56% (not including commissions) at the 15-1/4 low. When using this technique, our goal is not just to go long or short when a signal is given and then just wait to be stopped out; rather, our goal is always to attempt to buy as near the low as possible and sell near the high. We will utilize other techniques to attempt to pinpoint the most probable area for an important top or bottom. The Gann charts are there to protect you if you are wrong. In each of the above cases, we would on a worst-case basis have been stopped out at nice profits.
ENCOURAGEMENT AND SUGGESTIONS
Those who would like to use the Gann weekly swing chart should research its behavior and signals on each of your stocks for at least one year (and preferably longer), as each stock will show its own special nuances. There are also times when every stock enters narrow trading ranges, and these will produce whipsaws for brief periods of time. Inevitably, the stock will snap back in line and provide excellent buy or sell signals with reasonably tight stops.

