Articles
Trading with Gann lines By David Lamarr
Gann lines, although only a small part of W. D. Gann’s methods, provide an effective, straightforward way of determining support and resistance areas and times when to expect a change in trend. They can be thought of as “price/time” trendlines vs. the standard price-only trendlines many technical analysts use.
Gann strongly believed time was the major factor in determining when a change of trend could be expected. These Gann lines project the market’s natural rhythm on a price chart and have a distinct advantage over price trendlines by providing assistance in anticipating market moves vs. a price-following system, such as trendlines.
A harmonious relationship
Figure 1 demonstrates the harmonious relationship between market movement and Gann lines. From a wave low (point 2), Gann lines 1×1, 2×1 and 4×1 are drawn. Rally tops and bottoms can be projected in advance when the price action meets future Gann line resistance or support as of point C.
The use of points per hour is another representation of Gann lines. A 45-degree angle, or 1×1 line, can be mathematically represented as a one-time-unit-per-point change. On a daily chart, a 45-degree line would be drawn as one point per day. A 2×1 line is a movement of two time units per point, just as a 1×2 line is one time unit per two points of movement.
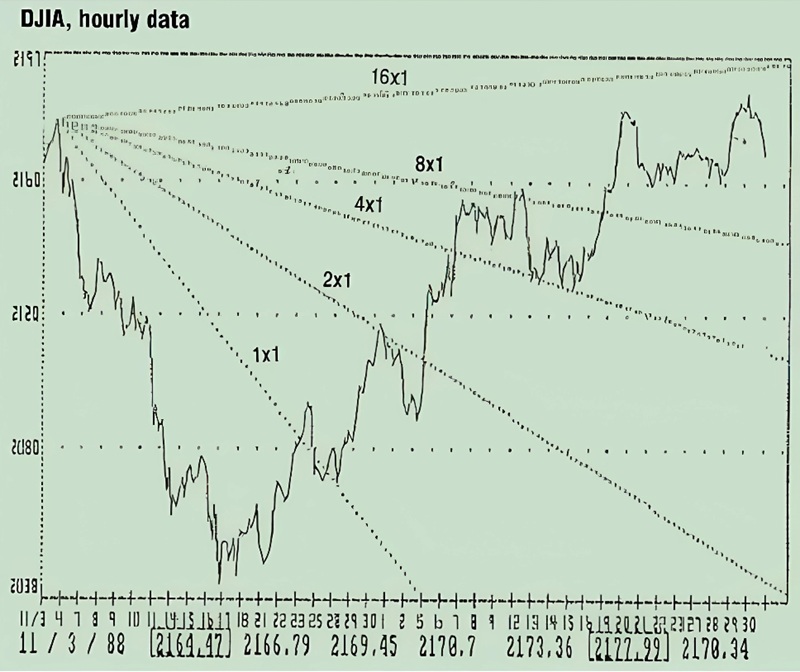
FIGURE 1: Rally tops and bottoms can be projected when the price action meets future Gann line resistance or support.
Because Figure 1 is not “squared”—that is, the price and time axes are in different scales—a 45-degree or 1×1 line may not look like a 45-degree line when drawn correctly.
Gann lines are drawn from all the impulse wave tops and bottoms, and wherever clusters of Gann lines intersect after the top of the fifth impulse wave, there are the probable corrective wave turning points (Figure 2). Significant support and resistance can easily be determined by the intersection of multiple Gann lines drawn from intermediate highs and lows. The longer the Gann line is not penetrated, the more strength it has in keeping price action from crossing it. If the price action is below the intersection of multiple Gann lines and moving upward toward the apex, the probability of a trend reversal is good. A small chance that the trend will accelerate exists, however.
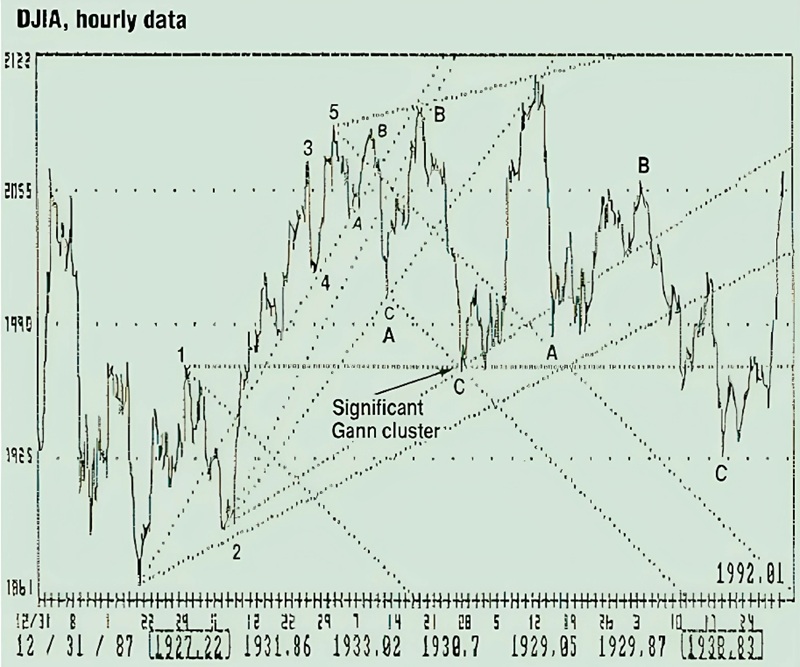
FIGURE 2: Wherever clusters of Gann lines intersect after the top of the fifth impulse wave, there are the probable corrective wave turning points.
The best way to estimate probable direction is to evaluate the breadth of the move under way. Does the Dow Jones Industrial Average advance easily with a 2-to-1 or better ratio of advancing to declining issues, or is the ratio about 1-to-1 with volume flat or decreasing? A strong, advancing move into a Gann intersection would indicate a trend acceleration with swift and volatile price action, applying to both bear and bull markets. Gann analysis on the DJIA daily chart is unreliable, however, and perhaps unusable, probably due to the theoretical high and low being used instead of the actual daily high and low.
📚 Study Gann’s Trading Techniques
Gann analysis improves the probability of correct prediction. Every technical analysis method, whether a moving average or stochastics, strives to provide the best “odds” for taking a position that would be profitable. The probability of things going your direction should be high, but a chance still exists you will be wrong. This is where money management plays a vital role. Because Gann lines display price support/ resistance and project zones for price reversals, strategies can be planned ahead of time. Once the price moves into the projected area, predetermined trade could betaken. If the price action moves against the position, Gann lines have predetermined the price at which to exit the trade—that is, when the price exceeds the line. Stops could be placed using this method and adjusted every few days to reflect the new level of the Gann line.
Gann lines provide an effective, straightforward way of determining support and resistance areas.
No single method should be relied upon to determine a buy or sell signal. Rather, the evidence from several indicators should be considered. Gann lines have proved to be extremely valuable to me when combined with Elliott wave analysis. I use Gann lines to reinforce the most appropriate wave count on the hourly charts. Surprisingly, when the wave count is somewhat cloudy, which is more often than not, Gann lines do help visibly in selecting the best count.
For example, when you can count the completion of a five-wave impulse move, any retracement value is virtually a guess. Will it stop at 38%, 50% or 62%? Gann lines provide a method of accurately selecting the probable retracement value. Gann and Elliott combined on the hourly chart reinforce each other. The highest probability for a successful trade is the goal, and combining two very successful methods yield results superior to either used alone.
David Lamarr is the founder of Winning Strategies and placed eighth in the U.S. Trading Championship’s fourth-quarter 1987 options division with a 129% return on investment.