The Definitive Guide to Forecasting Using W. D. Ganns Square of Nine
46.99 $
🎯Core Concepts:
- Geometry & Charting
- Time & Cycle Studies
- Trading & Strategy
Patrick Mikula’s The Definitive Guide to Forecasting Using W.D. Gann’s Square of Nine is one of the most comprehensive modern texts on applying Gann’s legendary forecasting tool. First introduced by W.D. Gann in the early 20th century, the Square of Nine (also called the “Odd Square” or “Master Price and Time Calculator”) remains a cornerstone for traders exploring the relationship between price, time, and geometry.
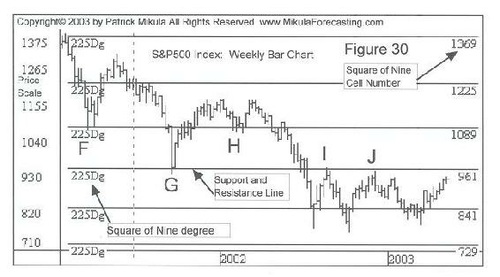
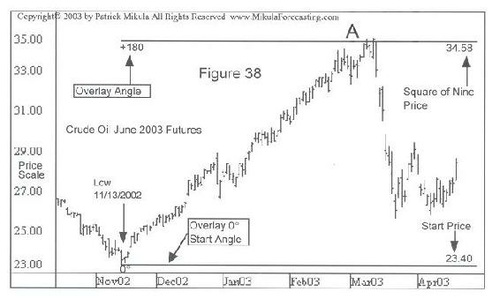
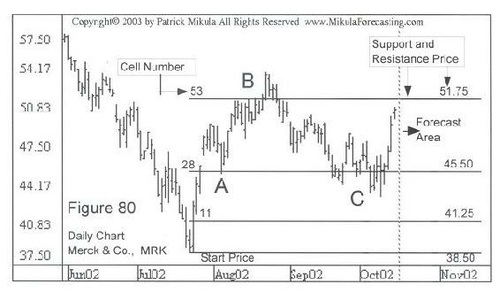
Mikula breaks down the Square of Nine into clear, step-by-step methods for forecasting both prices and dates. The book covers mathematical foundations, the use of cell numbers, angle overlays, shape overlays, regression, progression, and zero-base forecasting. Through numerous worked examples—from the S&P 500, NASDAQ, and Euro Currency to commodities like soybeans, coffee, and crude oil—Mikula shows traders exactly how to align the Square of Nine with market pivots.
Later chapters expand into price and time forecasting grids, planetary angle overlays, and Mikula’s own innovations such as the Square of Nine High-Low Forecast Indicator and Over-Under Indicator. These advanced tools provide a structured way to forecast turning points with remarkable precision.
Rich with diagrams, formulas, and real-world case studies, this guide is both a practical manual and a reference text. Traders who want to master Gann’s Square of Nine will find this book invaluable for understanding how price and time interact in financial markets, and for building reliable forecasting models rooted in Gann’s timeless principles.
💡 What You’ll Learn:
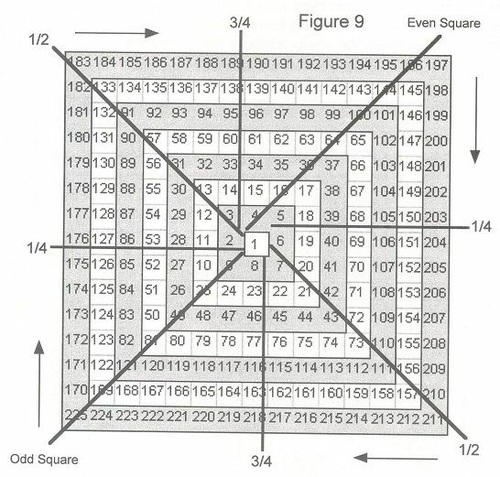
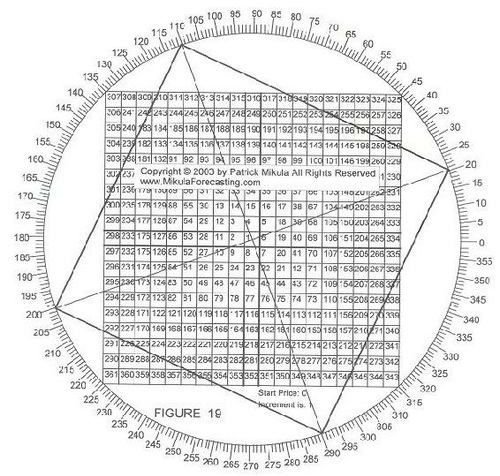
- The mathematical construction of the Square of Nine and its key principles.
- How to use cell numbers and overlays for forecasting price targets.
- Step-by-step methods for forecasting dates using pivots, overlays, and cycles.
- Application of progression, regression, and zero-base methods.
- Building Price and Time Forecasting Grids for combined analysis.
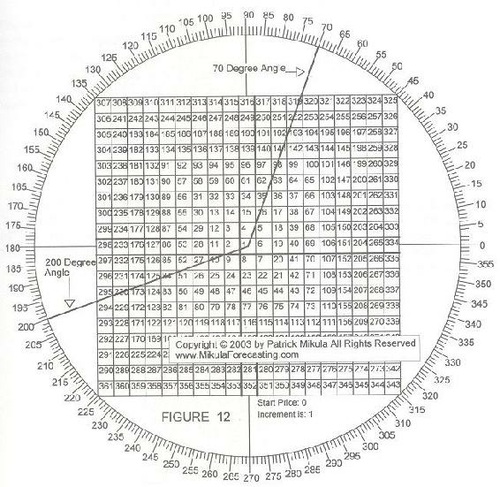
- How to apply planetary angles within the Square of Nine.
- Mikula’s proprietary indicators: High-Low Forecast and Over-Under.
- Practical chart examples across indices, commodities, currencies, and stocks.
Some Pictures From the Book
The Definitive Guide to Forecasting Using W. D. Ganns Square of Nine By Patrick Mikula
| Author |
Patrick Mikula |
|---|---|
| Pages |
209 |
| File Types |
|