Articles
Practical Application of an Authentic ‘Square of Nine’ – Part Two

When the Lambert-Gann Educators research team found a ‘Square of Nine’ in the Lambert-Gann Publishing Co archives with a revolving date ring and movable Cardinal and Ordinal crosses, we knew that a major key to the use of Mr. Gann’s ‘Square of Nine’ had been discovered. In ‘Practical Application of an Authentic Square of Nine’ Part One, I showed how to set up the ‘Natural Squares Calculator™’ to be in harmony with the price of a market top or bottom. To do this I simply shift or rotate the Cardinal and Ordinal Crosses so that the Cardinal Cross angle from the center is aligned over the price of the high or low.
In this article I will show how to use the movable date ring on the ‘Natural Squares Calculator’ to shift time also so that it is in harmony with the date of a market high or low. The chart included with this article is of continuous December Corn. According to Mr. Gann’s teachings, we should link together all of the December Corn contracts forming one continuous file that gives us data back into the 1800’s.
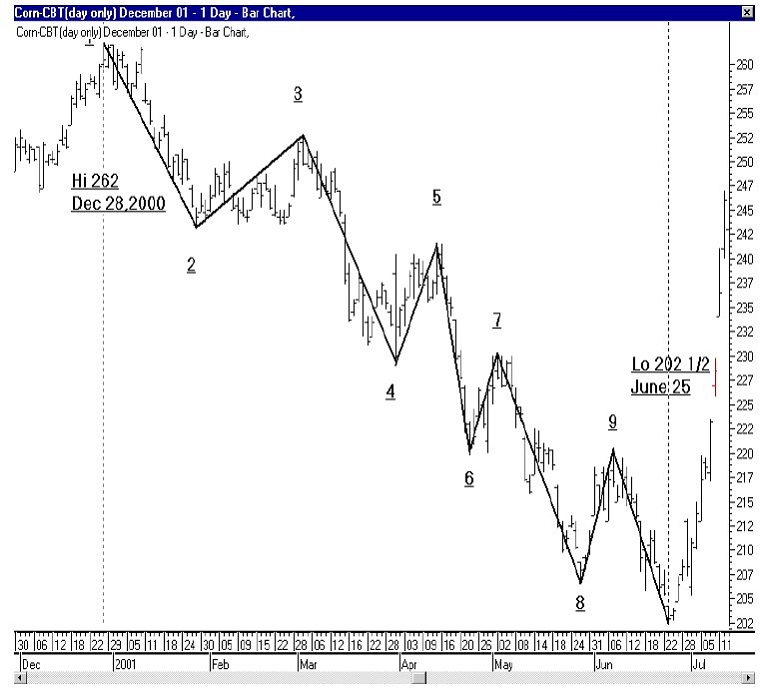
This particular section of the chart begins with the major high of 262 on December 28, 2000. Since the high occurred after the expiration of the December, 2000 contract, this section of the chart will cover data from the December, 2001 contract. The ‘Natural Squares Calculator’ has separate rings which allows for moving the Cardinal and Ordinal Crosses (the degree ring which shows where the Crosses form) separately from the date ring.
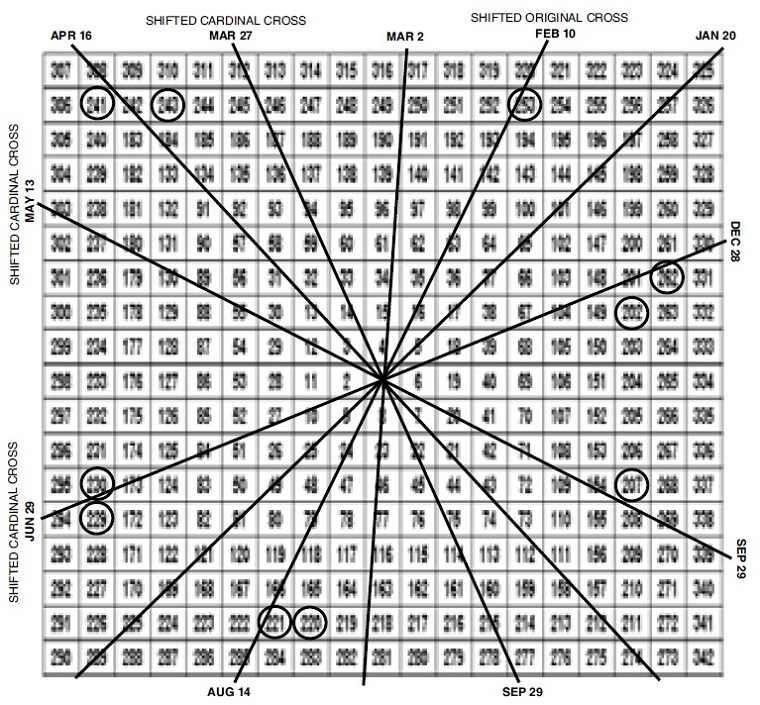
To align the ‘Natural Squares Calculator’, we rotate the counter-clockwise date ring so that the red bear market date of December 28th (date of the 262 high) is on the same angle from the center as the zero degree angle. Correctly done, the zero degree angle or the right side of the Cardinal Cross should be over the price of 262 and extend to the red date of December 28 (see picture below).
We have now set up the Calculator in both price and time harmony (see picture) with this high and should expect both trend and countertrend movements to vibrate with this alignment if we have used the correct high or low as a starting point. With the date of December 28th set over the high price of 262, we can now introduce the concept of Synchronized Solar Time™ (hereafter called SST). In this example, Mr. Gann’s natural time divisions of the calendar year have been reset from equinox and solstice times to natural SST divisions with the beginning on December 28th. The table below shows the natural SST times and their corresponding price squaring.
| One eighth SST | February 10th | 252 ½ |
| One-quarter SST | March 27th | 246 |
| Three-eighths SST | May 13th | 236 |
| One-half | June 29th | 230 |
| Five-eighths | August 14th | 221 |
| Three-quarters | September 29th | 215 |
| Seven-eighths | November 13th | 207 |
| Full cycle | December 28th | 2011/2 |
In addition to the natural SST divisions, each day after December 28th squares with the price that is on the same angle from the center as that date. In other words, each day forward from Dec 28th on the red bear market date ring creates a current SST angle squaring with a slightly different price. For example, January 20th would square in the upper right hand corner with the price of 257. The first rally high marked No 3 on the chart peaked at 252 ¾. This rally is exactly one-half way back from the low at 243 to the high of 262 and up against the shifted ordinal cross.
📈 Learn Gann’s Trading Techniques – Recommended Courses
Ultimate Gann Course By David Bowden
Original price was: 7,995.00 $.141.38 $Current price is: 141.38 $.WD Ganns Master Time Factor – The Astrological Method By Myles Wilson Walker
Original price was: 450.00 $.67.08 $Current price is: 67.08 $.In addition, the rally top occurred on March 2nd, which squares with the price of 249 ½. The market rally carries 3 ¼ cents over, then immediately reverses and goes back below the current SST. The market makes low No 4 at 229 on the 180-degree angle from 262. In addition, that low is on the date of March 30th, which is within 3 days of being on the 90-degree angle from December 28th. This is a common occurrence and shows how a natural SST is a great place to watch for price reversals. The next rally high at No 5 occurs on April 16th. This is the first time since the March 2nd that price has been able to get back up toward current SST. The high of 241 ½ occurs on April 16th exactly on the current SST angle (see picture).
From this high the market accelerates the decline and never is able to get back to current SST. This in itself is a great clue about the weakness of this market. Part One explained the continuing vibration of price on the shifted Cardinal and Ordinal Crosses for the rest of the decline. The final low of 202 ½ marked No 10 occurs within one cent of the 360-degree angle in price. In addition, the low occurred on June 25th, which is within 4 days of the 180-degree angle from December 28th. Again we have an example of a major change in trend occurring on a natural SST and a Cardinal cross price. The combination of natural and current ‘Synchronized Solar Time™ (SST) and shifted Cardinal and Ordinal price divisions are extremely important in understanding market vibrations. This December corn example proves that by using the correct high or low in a market, we can harmonize the ‘Natural Squares Calculator’ to identify the vibration currently active in the market.

