Articles
Forecasting Time Frames Using Gann Angles By Jason Sidney
When you apply Gann Angles to a chart, apply them for a specific reason. You want them to tell you something. But, in order to do that you need to know what it is they actually do and why you’re applying them to that specific point on the chart. Gann Angles are in many ways a “calculator” that proportionally divides time and price for you in a visual way.
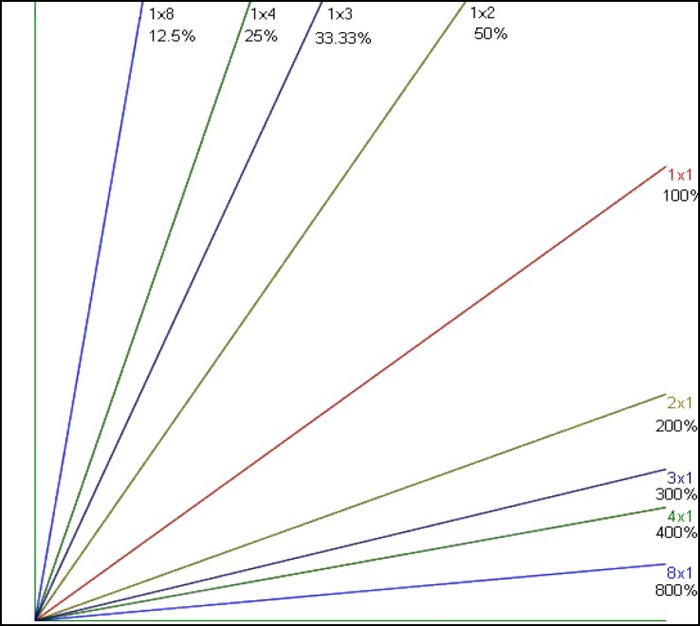
The diagram that follows shows a typical Gann Fan. The Gann Fan consists of a number of lines radiating at various angles. You will find Gann Fans in most charting packages available on the market today. In this example I have divided a typical square into eighths and thirds using the Gann Fan.
These days we talk more in terms of percentages, and as a result this fan is also marked with equivalent percentages that relate to Gann’s eighths and third divisions. So let’s take a closer look at some of these angles to see what it is the Gann Angles are actually doing. The middle line is the 1×1 angle, and it divides the square in half in both time and price. This angle rises at a rate of one point for every time period and has a 1:1 relationship, representing 100% in time of the square. The time period used in the Gann Fan can vary from calendar days through to trading bars. Trading bars can be anything from days, weeks or months, based on what the time period is on the underlying chart you are viewing. For example, if you are looking at a daily chart the angle will rise at one point per day a daily chart and if you were looking at a weekly chart the angle will rise at one point per week.
The 1×2 angle is the steeper line just above the 1×1 angle. It rises at a rate of two points for every time period and represents 50% or ½ of the square in time when it reaches the price level at the top of the original square. The 2×1 angle is the shallower angle that can be found below the 1×1 angle. This angle falls at a rate of one point for every two time periods. If it were to continue at that rate of ascent it would represent double or 200% in time of the original square when it reached the price level at the top of the original square.
The 1×3 angle is a steeper angle and is above the 1×2 angle, it rises at a rate of three points for every time period. It represents 33.33% or 1/3 in time when it reaches the top of the square.
The 1×4 angle rises at a rate of four points for every time period. This angle divides the square by 25% or ¼ in time at the top of the square. As you can see these angles are mathematically dividing the square by both time and price using basic geometry. The beautiful thing about Gann Angles is that they do all this for you automatically just by placing them on any high or low on your chart. As an analyst, you can use these angles to mathematically calculate percentages of price and time on highs, lows, and ranges. These percentages will mathematically give you dates and price levels to watch in the future.Why use a calculator when you can simply apply Gann Angles?
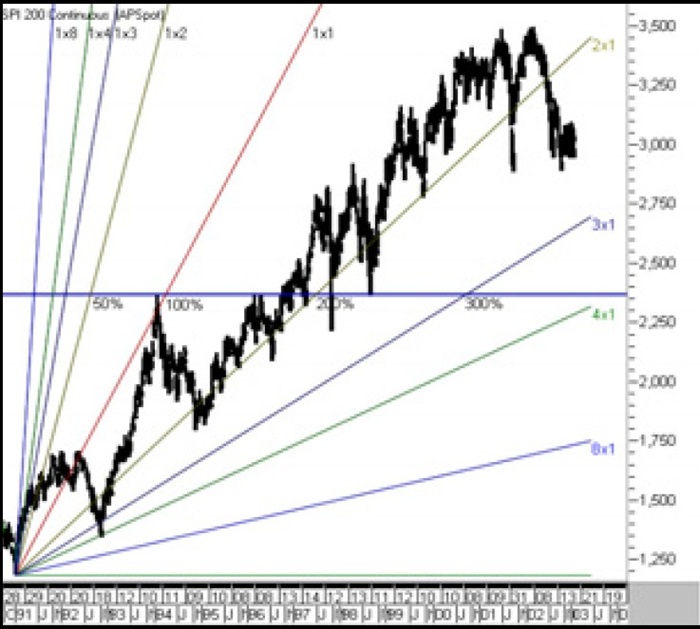
Let’s take a look at how we can use this tool on a chart. Looking at the following chart, you can see a Gann Fan has been placed on a reasonably significant low on the Australian SPI 200 which was 1184 -16/1/91 and is well known as the “Gulf War low”. The blue horizontal line is the Gulf War low doubled. In this example, doubling the low identified the exact price level of a major high 2368 – 3/2/94 and a significant turning point three years later.
📘 Ebooks on Gann’s Methods & Techniques

Once we know this price level the Gann Fan can be used to mathematically calculate percentages in time of the 1184 low. It is important to point out that not only is it calculating percentages in time of the price of this low, it is also calculating pressure points in time of a significant event in history – the Gulf War. Considering the recent conflict between America and Iraq, a repeat of that event is highly probable. It’s interesting to point out the American President during the Gulf war was George Bush, and the American President pushing for war this time round is George Bush’s son, George W. Bush. If this isn’t an example of history repeating, I don’t know what is! As I mentioned before, that by simply doubling the low of 1184 gave you the exact price level of a significant high, which was 2368 3/2/94. It is also interesting to point out that when the 1×1 reached this price level it counted forward 100% in time using calendar days and came within a few weeks of identifying the time frame of this high.
An almost perfect example of time and price alignment! When the 1×2 crossed the horizontal line it calculated 50% forward in time from the low of 1184. The 2×1 calculated 200% in time from the low of 1184 -16/1/91, and the 3×1 calculated 300% in time from the low of 1184 -16/1/91.
Each of these calculations Most came within weeks of identifying significant turning points on the bigger picture. Looking at the same chart, the 4×1 represents 400% in time from the low of 1184 and comes out on 2 January 2004. The anniversary of the low itself occurs on 16 January each year. Applying the same concept to a monthly chart reveals an interesting month for the year 2003 which may very well coincide with a war between America and Iraq.
Considering recent conflict between the two countries it is a very real possibility. As mentioned previously, not only are these angles calculating pressure points in time based on the price and date of a low, they’re also calculating pressure points in time from an event in history, in this case, the Gulf War. In this example the Gann Fan has been placed on the low of 1184 -16/1/91 as before, but the underlying chart is a Monthly chart. This is a very long-term chart, so the 1×1 Gann Angle is only rising at a rate of one point for every month. As you can imagine, it will take it awhile to get anywhere near the current market action rising at that rate. The 1×8 on the other hand rises at a rate of eight points for every month, and is certainly a lot more relevant to the current market action.
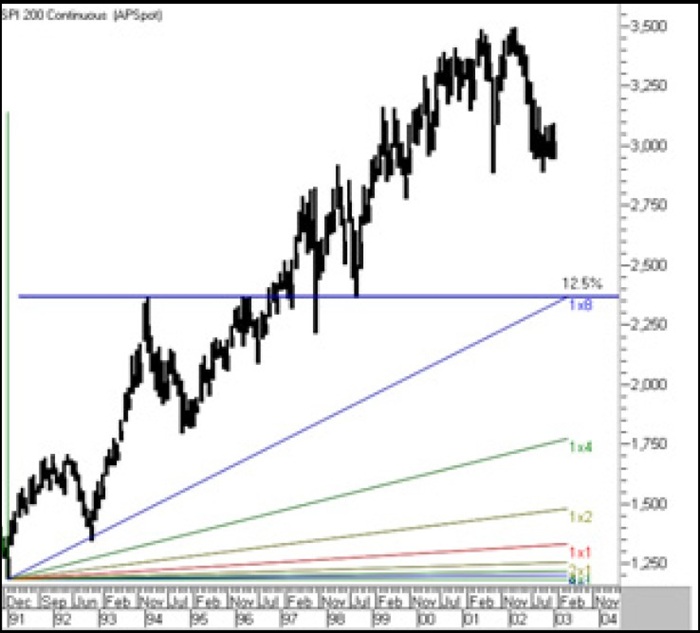
It has been rising at this rate since the 16/1/91. It has taken it awhile to get there but it is now the first angle in this Fan to become relevant to current market. As mentioned before, when the 1×8 angle reaches the horizontal line, or the price of 2368, it will represent 12.5% in time from the low of 1184 on the 16/1/91. The time frame it indicates for the year 2003 is the month of May. Will war break out between America and Iraq in May 2003? Who can really say, but as you can see, forecasting future time frames with Gann Angles using basic geometry is just as relevant to events in history as it is to highs and lows found in the market. It’s the events in history that create these highs in lows in the market and in our lives, and should be remembered as result of it. So there you go, Gann Angles are a fascinating tool, often misunderstood and rarely used correctly. So remember when you apply Gann Angles to your chart, apply them for a specific reason!
Jason Sidney can be reached at www.market insight.com.au Market Insight Pty Ltd is an educational company that promotes the use of geometry as a forecasting and analysis tool for financial markets. These techniques have been used by analysts for close to one hundred years, and attempt to create “order” from apparent “random” activity using the basics of mathematics.