Articles
An Applied Glimpse Of Gann By Mak Sangha
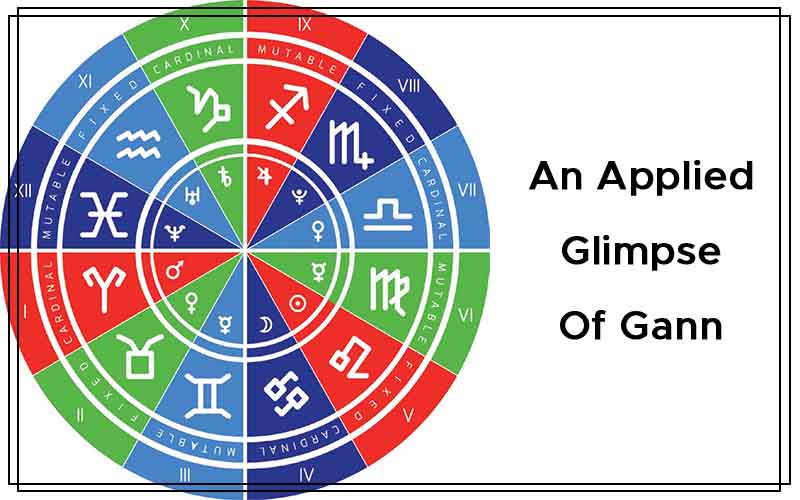
Let’s have some fun with astrology and the financial markets. Mathematically inclined traders are aware of the importance of the Fibonacci ratio of 1.618, its inverse, 0.618; its square, 0.382; and so on. However, it may come as a surprise that we don’t see these important numbers in any of the materials by W.D. Gann, the renowned trader and analyst who lived from 1878 to 1955. How did a mathematician like Gann miss such important numbers? He didn’t. What Gann did was divide a circle he called a spiral chart (Figure 1) into many parts including eighths. For example, 3/8 of 1 is 0.375 and 5/8 of 1 is 0.625. The difference between 0.375 and 0.382 is 0.007, and so is it the case with 0.625 and 0.618. It doesn’t mean we should ignore the Fibonacci ratio in Gann analysis in favor of eighths, or vice versa. In fact, using Fibonacci numbers in Gann analysis can yield highly accurate results.
One of the concepts in astrology is that the natal horoscope shows what is promised in the future. In the context of the financial markets, the natal horoscope of a stock, commodity, index, or so on should show the price levels that will occur at a given time. For this to happen, the natal position must be activated. This is the same thing as Gann’s concept of active angles and time–price charts. For example, let’s look at the NASDAQ’s natal horoscope (ignoring the ascendant, the medium coeli, and the moon) in degrees up to one decimal place on February 8, 1971:
- Sun = 18.6 Aquarius = 318.6
- Mercury = 0.2 Aquarius = 300.2
- Venus = 2.6 Capricorn = 272.6
- Mars = 10 Sagittarius = 250
- Jupiter = 3.7 Sagittarius = 243.7
- Saturn = 16.1 Taurus = 46.1
- Uranus = 13.4 Libra = 193.4
- Neptune = 2.9 Sagittarius = 242.9
- Pluto = 29.3 Virgo = 179.3
- Moon’s node = 24 Aquarius = 324
FIGURE 1: GANN CIRCLE. Here you see a simplified version of Gann’s circle. You get an idea of how the divisions line up with astrology.
Here are some examples that show important dates, although these examples aren’t isolated:
March 10, 2000, high of 5132.52: Uranus was hovering over the natal Sun at 318.6 or 3186. The ratio of price to the natal position was 1.611, off by just 0.007.
October 8, 2002, low of 1,109.64: Saturn was at 29.1, Gemini activating the natal Pluto at 179.3. The ratio of 1,109.64 to 1,793 is 0.619. The average of Jupiter at 13.4 Leo and Saturn at 29.1 Gemini positions on this day was 1,112.5. Moreover, 1.618 raised to the fifth power is 11.09.
March 12, 2003, low of 1,253.22: A significant secondary low occurred. Jupiter was at 9, Leo activating the natal Mars at 250. The ratio of 1,253.22 and 2,500 was one-half.
July 20, 2015, high of 5,231.94: Jupiter was at 24, Leo activating natal node at 324. The ratio of price to the natal position was once again 1.615.
🧠 Deep Dive into Gann’s Methodology


Astrology for Gann Traders By Olga Morales
Original price was: 491.00 $.71.20 $Current price is: 71.20 $.Similarly, the most recent fast decline from 5,116.99 on December 29, 2015 can be explained with 318.6 and 5/8th. Looking from gematria perspective, there is no difference between the March 2000 high of 5,132, the March 2003 low of 1,253, and the July 2015 high of 5,231. It’s the same number expressing itself differently.
All past and future important resistance levels of the NASDAQ Composite can be figured out this way. Individual stocks can be analyzed along similar lines. The key is to find each stock’s vibration and arrive at its correct time–price chart through proper study of cycles. The NASDAQ Composite is an easy one. This is just a glimpse of what can be accomplished if Gann’s system is properly understood and applied.
Mak Sangha, CFA, is a private analyst in Toronto, Canada. He has a bachelor’s degree in mechanical engineering, a master’s in industrial engineering, and an MBA in finance.