Articles
How to Use Gann Fan?
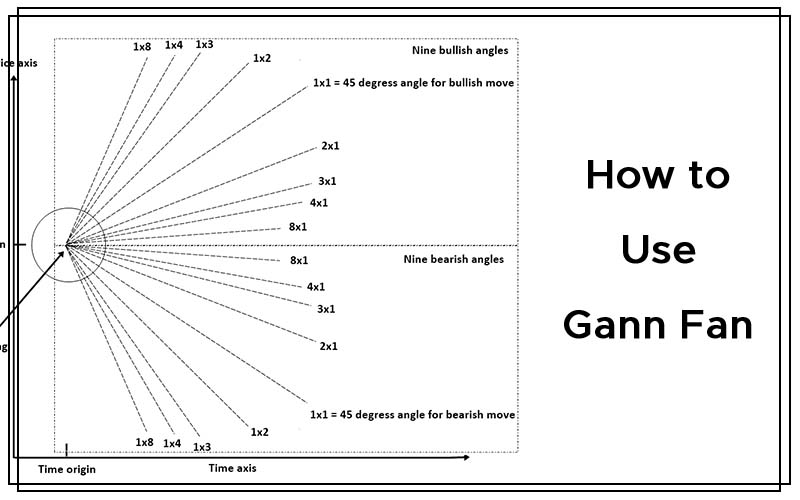
First of all we should know that this is an easiest way to analyze stocks. This theory is, I think made difficult by the analysts as per their convenience and how they incorporate Gann theory in their analysis. While analyzing stocks with Gann we must have to remember three things which matter most. That is ‘Price ‐ Time &‐ Range’.
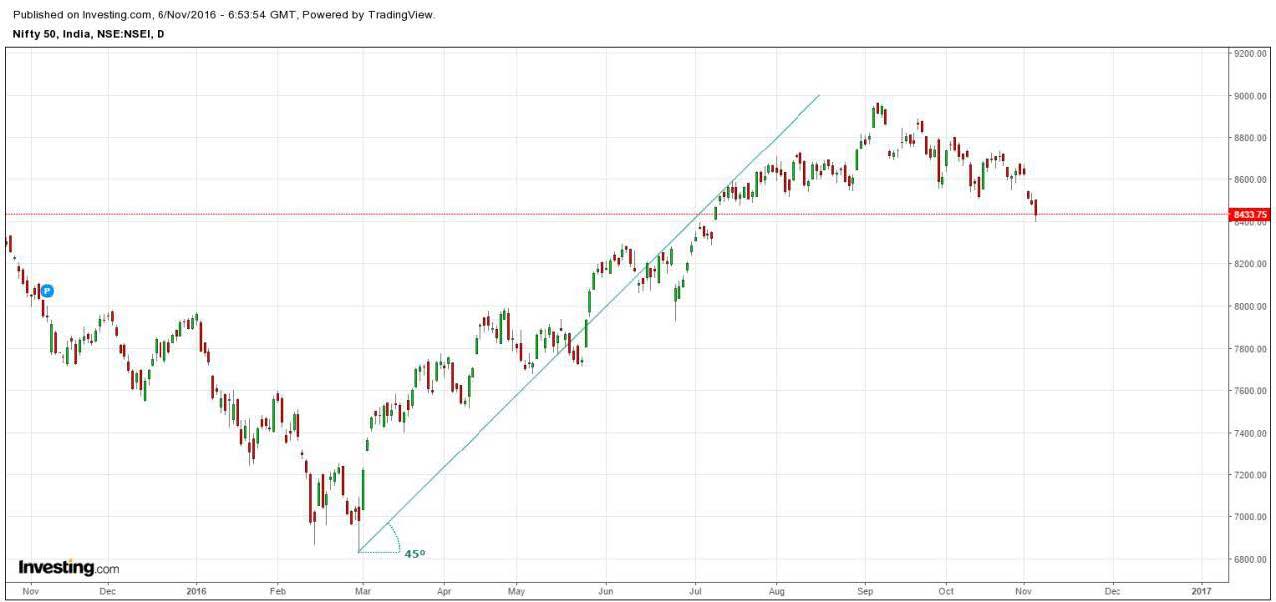
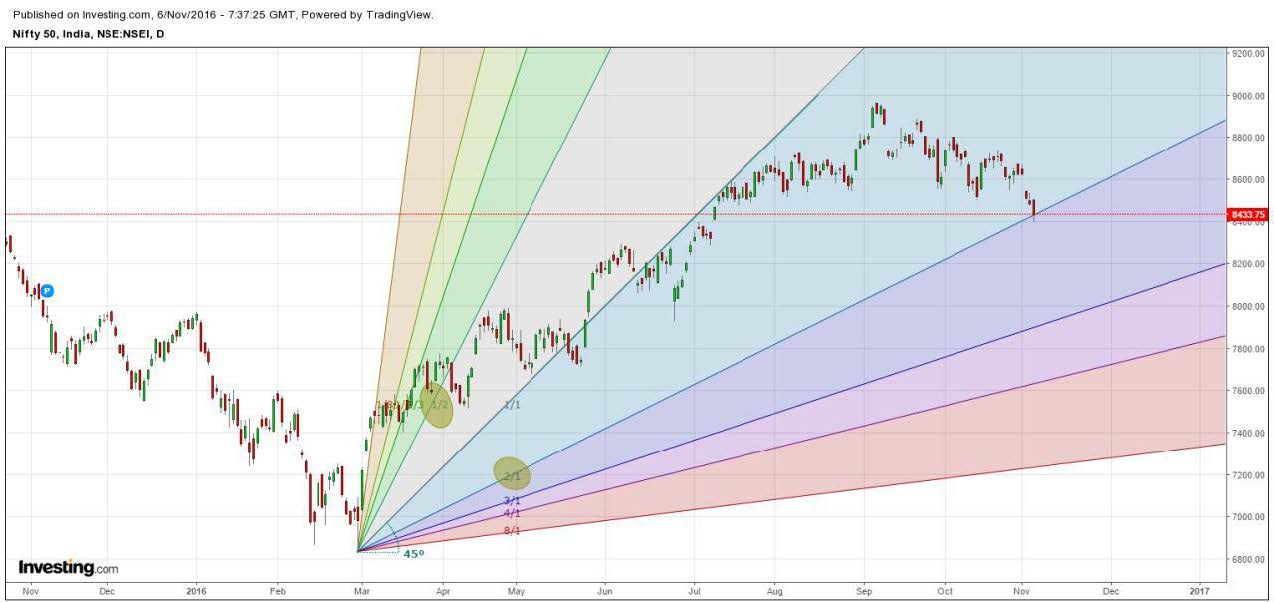
We start by drawing 45° degrees angle from the significant lows or from the significant highs. In this case of Nifty50 Chart we are starting with significant lows. Probably which was scaled on the budget day.
Nifty is trending below 45° line
The 45 degree line is important because the 1X1 line which we see in Gann Fan actually overlaps 45 degree angle. This is nothing but it says that with 1 Unit of time movement there is 1 unit of price movement.
1×1 line overlapping 45 degree angle.
- Q: Sir 1 unit of time is considered as 1 day? And 1 unit price means how much?
- A: It could any time frame.
I’ll make further simpler to understand by showing time on X‐axis & price on Y‐axis.
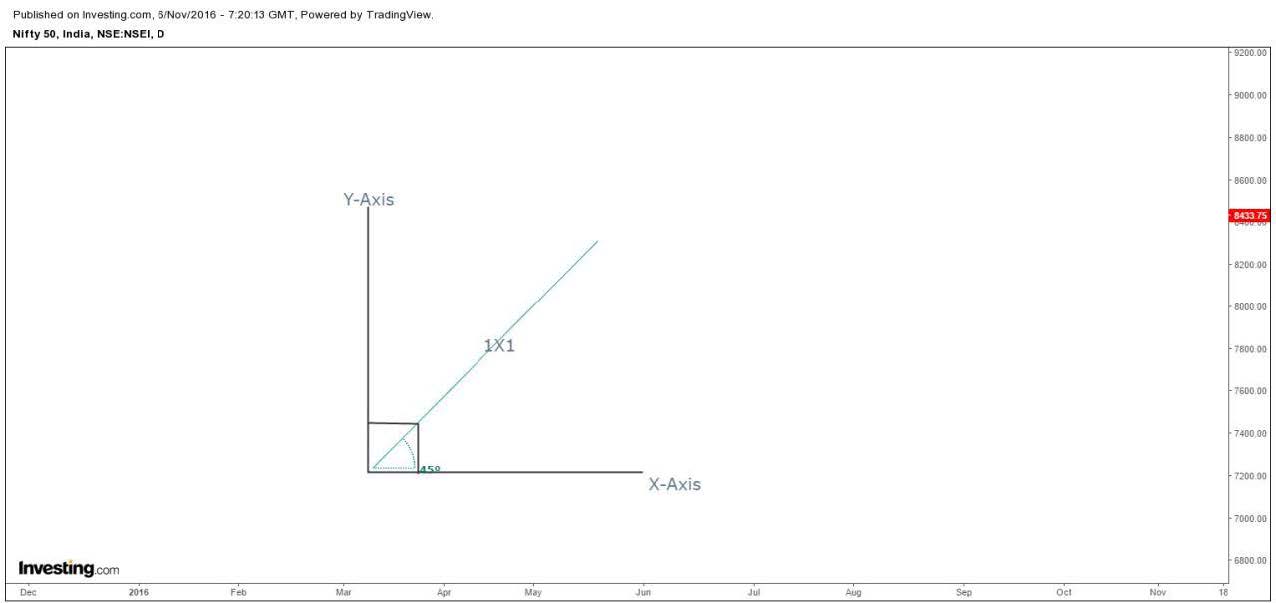
One unit of time movement is equal to one unit of price.
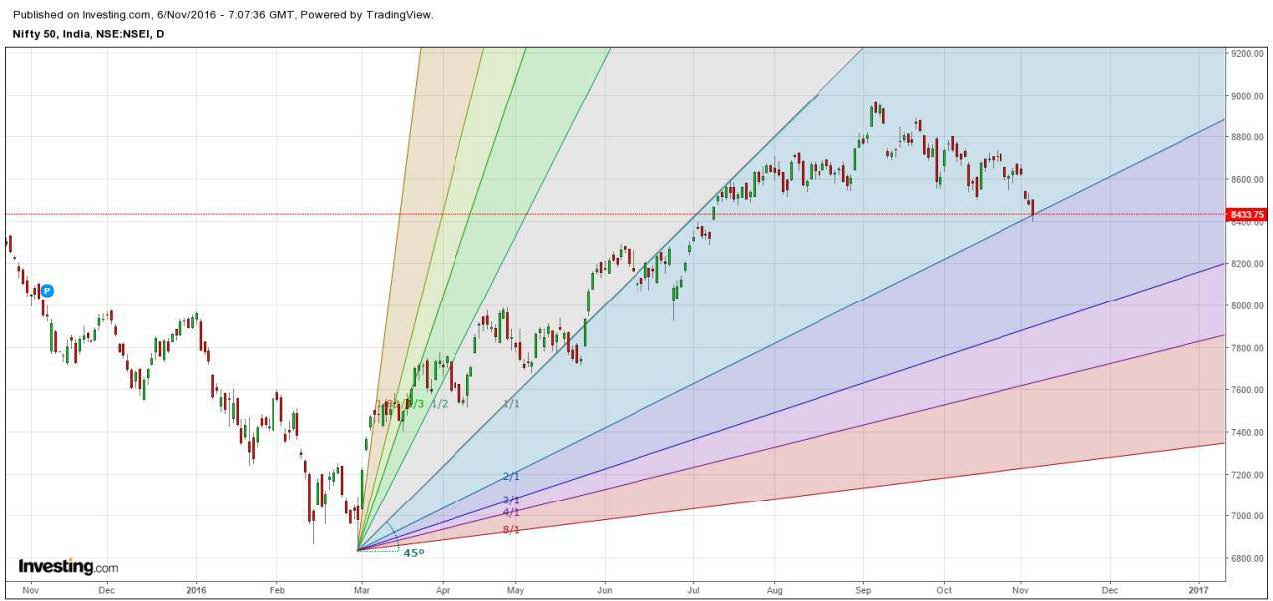
The most important assumptions of Gann analysis are that it assumes that the financial markets are cyclical in nature and the price movements are geometric. So, there is every chance for the history to repeat itself. So once you have understood as to draw Gann Fan and the basic knowledge of the analysis. The next step is how to predict price using Gann Analysis. Now if you see in the charts the Gann Fan consists of multiple angles. 1×1, 2×1, 1×2 etc. Let me show you with the help of the charts.
2×1 and 1×2 highlighted. Analysts also say Two by one and one by two.
- Q: Sir, what difference it will make if price falls in different angles?
- A: We will go ahead step by step so that everyone can understand.
These 1×1, 1×2 and 2×1 are the important angles of the Gann fan. One by one actually means that with one unit of time the price moves one unit. While 1 by 2 means that with one unit of time the price move two units. And 2 by 1 means that with every two units of time the price movement is only one unit.
As we can see in the charts, the Gann Fan consists of nine line (usually). That is 1/1, 1/2, 1/3, 1/4 and 1/8. Price in this range moves rapidly upward.
🎓 Courses on Gann’s Methods & Strategies


While when the slope of the lines is falling, the price action is relatively subdued. So, the Gann Fan has four lines on the down side of 1/1 line. They are 2/1, 3/1, 4/1 and 8/1. This means the price moves are quite slow as the slope decreases. Like in the case of 8/1, it means in 8 units of the time the price moves only one unit.
- Q: What will be the angle of these lines…? I hope one of the line is 45 degrees
- 1/1 is 45 degree line 1/2 will be 22.5 degree. Likewise 1/3 and so on

Gann Angles
Here we don’t have to dig deep into the angles and better focus on our basic studies. This is, how to use Gann for predicting price of an asset based on past movements. Let the rest be done by the software. Is it clear up to here?
- Q: What software sir?
- A: Investing.com charting software is perfect for our analysis and it’s free.
If you have you understood up to here then we can move on to the most important part of our study. Which is function of these lines and price prediction. Great! So, let’s bring is the chart again.
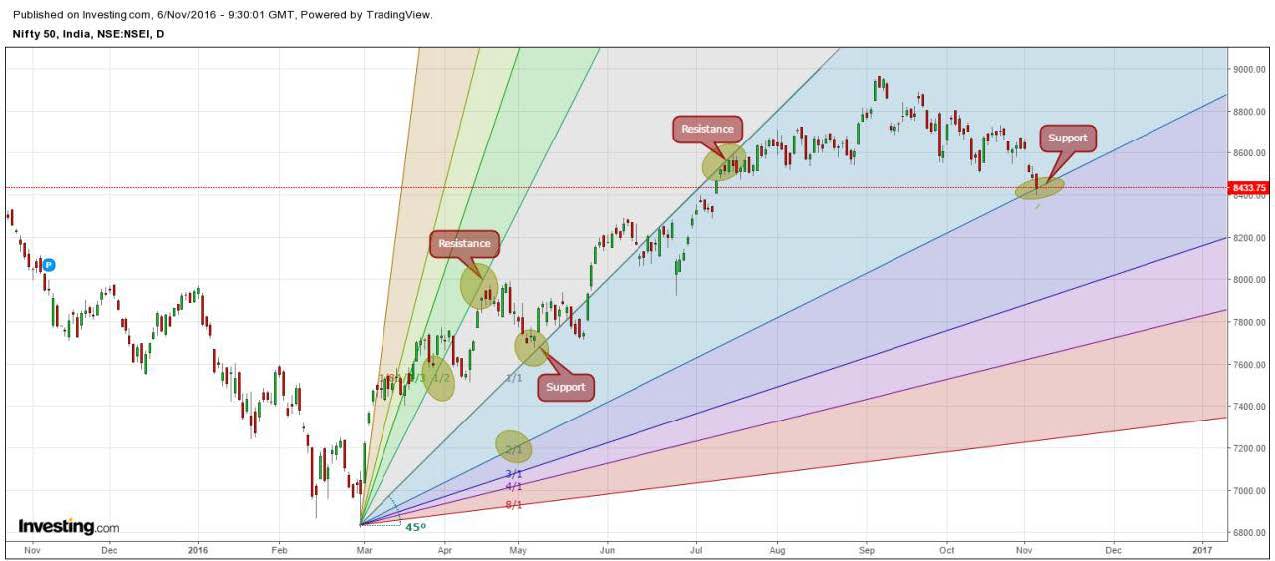
Support and resistance on the daily chartsLines within the Gann Fan acting as supports and resistance. To have more comprehensive insight into the charts of Nifty50 let’s move to the weekly charts to have clear picture of the price movement.
- Q: Sir I have few questions in mind but let u finish first
- A: You can ask while I readjust my charts?
- Q: Gann chart of nifty clearly shows that nifty is at its crucial support. If it breaks8200 is near
- Q: Let nifty break 8k before 10th 😉
- A: On daily charts it looks like the bounce is imminent.
- Q: I think next support is 8000. How to say that bounce is imminent?
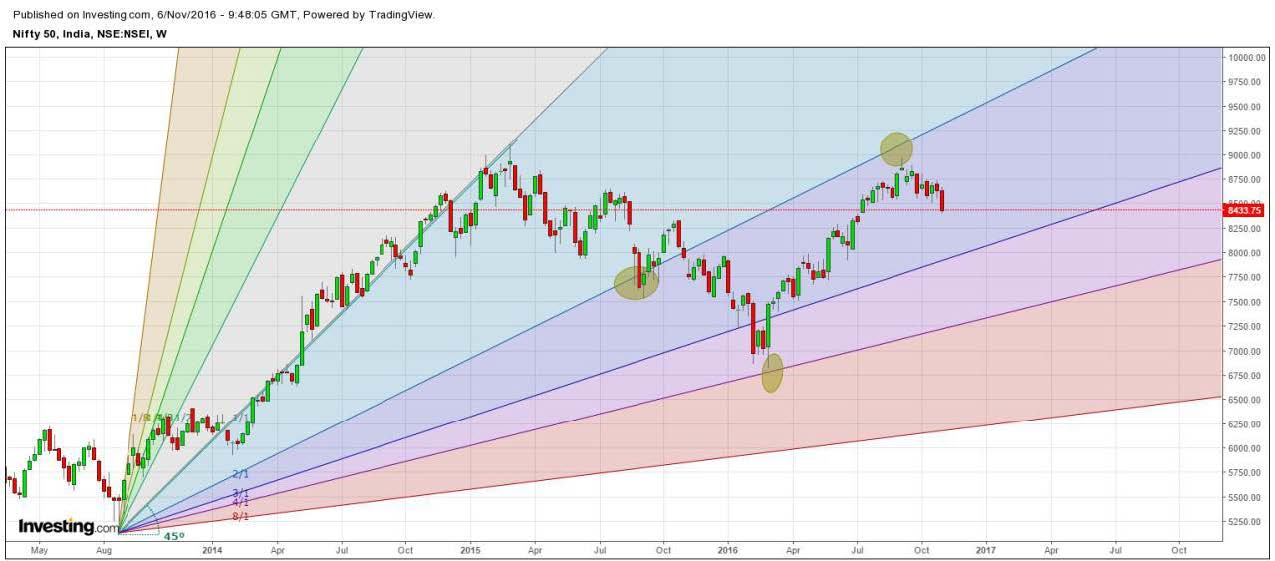
- Q: Weekly chart another story😂😂😂
- A: That’s why I had to bring in weekly to have second view.
Going by moves since budget and If Nifty moves within 2×1 and 3×1, then the implied technical target of Nifty comes to around 8775 on 1/1/2017.
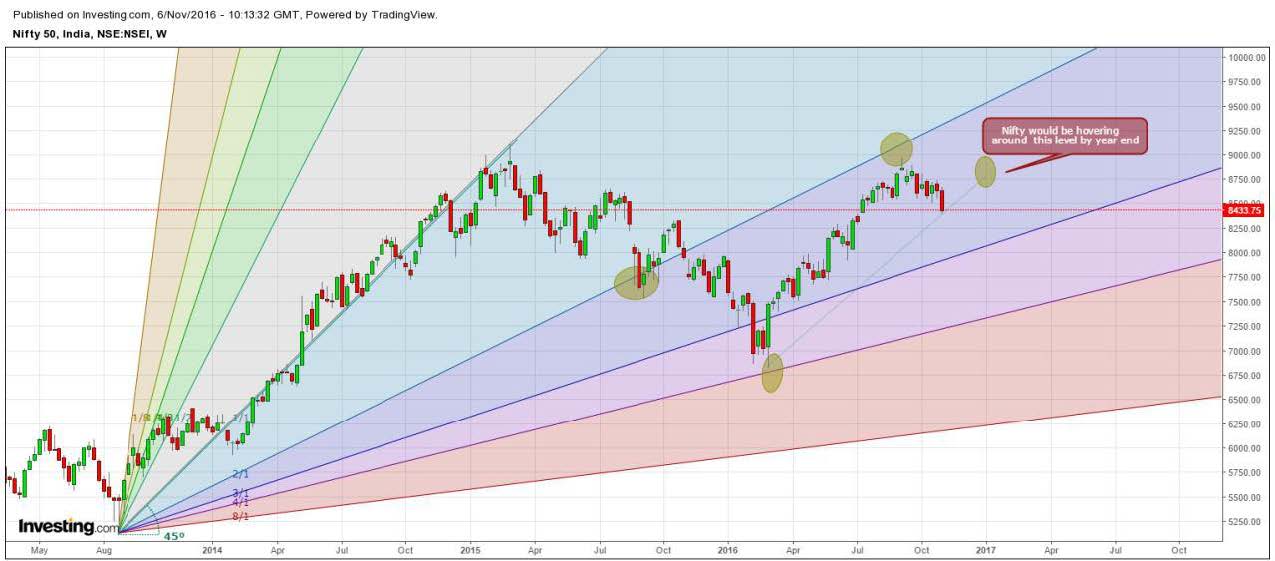
Projected levelsWith this we come to an end of this session. I hope you have all benefited!