Articles
Gann’s Greatest Secret

Author’s Note:
No one person has spawned more market folklore than W. D. Gann. Every issue of every market magazine has ads for courses that in one way or another reveal a GANN SECRET. Most of these courses are standard Gann material, based on one of Gann’s courses or some letters, or someone who knew Gann, etc. With everyone out selling all these secrets, how can there be any left?
Well, there is. Most people who are out selling Gann material (1) don’t really understand it, and (2) haven’t done their own homework on it. What you are about to read not only shows you one of Gann’s Greatest Secrets, but tracks it to its source, analyses it, applies it, and extends it. When you are finished, you will have a whole new appreciation for Bill Gann, if not as a trader, as a student of the forces that move the markets. I assume that by now you have read every book written by Gann, and maybe taken a Gann course or so. I will not cover any of Gann’s work available elsewhere, such as Gann angles, squares, etc. I prefer to provide you something totally unique. That’s how I add value.
This is a journey more than a report. You are to be involved, think, and participate. I will lead you down the path, show you a few things, and challenge your mind. I expect you to study carefully, think about what you read, and figure out how to integrate it into you own market activities. Now let us begin.
Gann ‘s Master 20 Year Forecast Chart
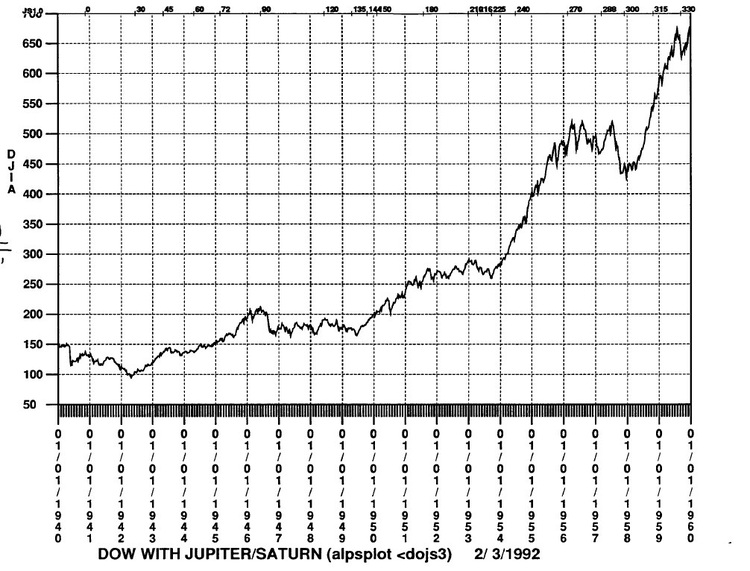
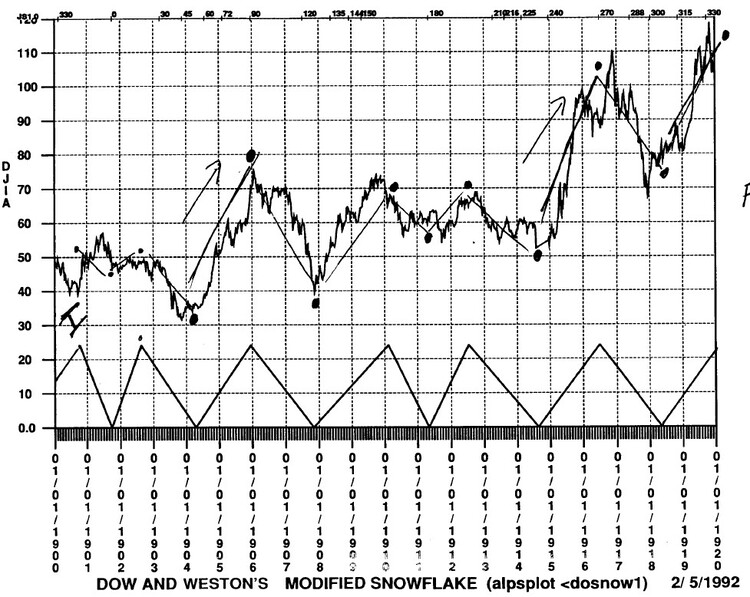
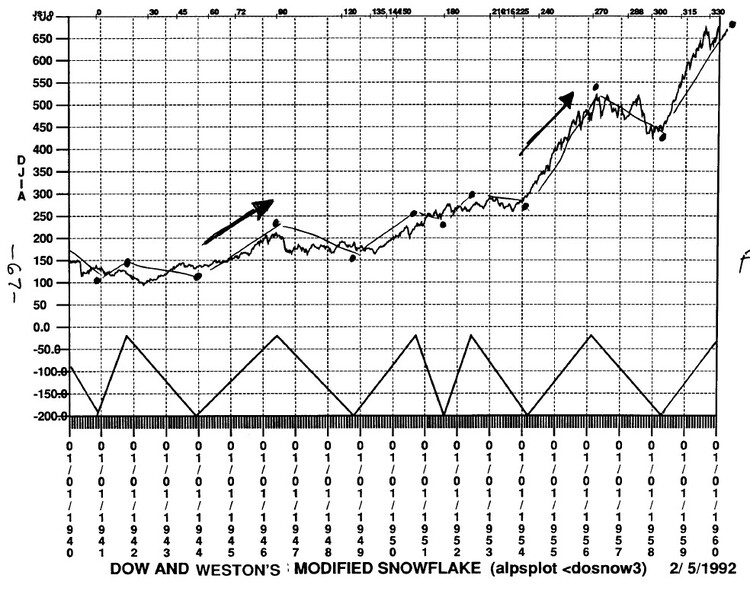
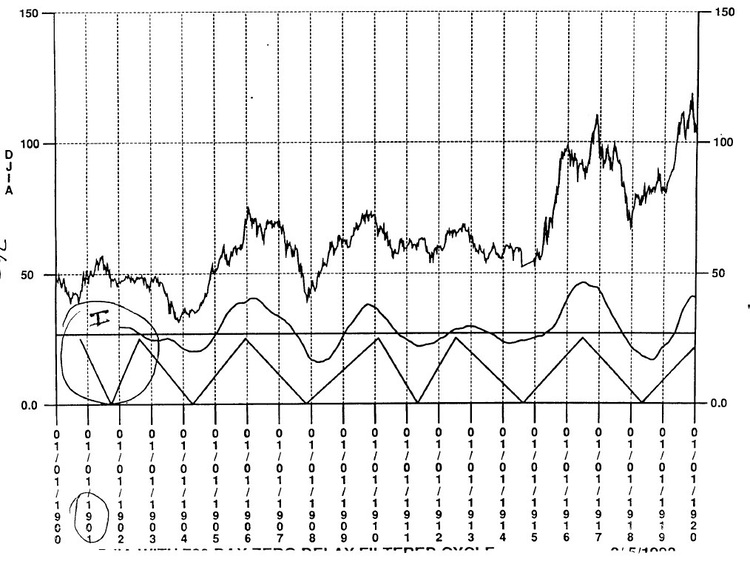
Figure 1 is an admittedly poor copy of Gann’s 20 Year Forecasting Chart. If you study it very carefully, you will see that it is a plot of the Dow Industrials, repeated every 20 years. It starts at 1901 and plots prices to 1920, then starts again at 1921 and plots to 1940, etc. So what was Gann doing? He was simply looking for the Jupiter/Saturn cycle in stocks. Throughout his life, this is the one chart that Bill Gann always kept up to date. If you haven’t learned yet that Bill Gann was an astrologer, you now know. Financial astrology has for scores of years, long before Gann’s time, held that Jupiter was the Bull of Business, and Saturn the Bear.
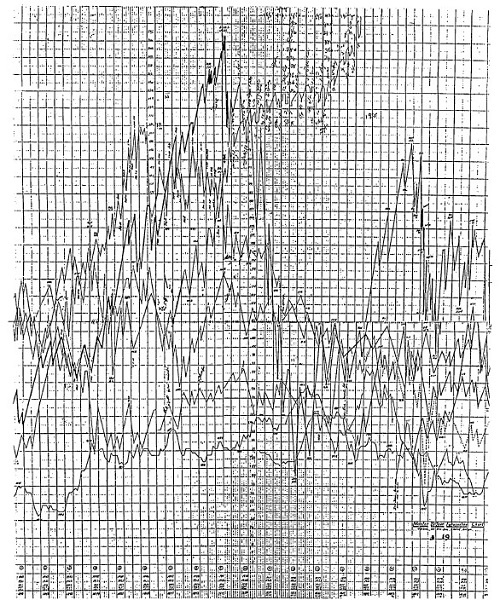
Figure 1
So it is very logical for Mr. Gann to be trying to find the JS (Jupiter/Saturn) cycle in stocks. If one starts a chart when J and Sare in a line on the same side of the Sun (called a conjunction), as they were in 1901, and plots prices as Jupiter moves around and again catches up with the slower moving Saturn, you have plotted price versus one JS “synodic” (coming together) cycle. If you repeat this for five or more cycles, and then “stack” the charts, or overlay them on the same piece of paper, any consistant pattern should be visible. If you are mathematically inclined, you could average the prices for each corresponding month in each cycle, and use that to predict the next cycle. This is a very ancient cycle extraction technique. It relies on the assumption that effects due to causes other than the cycle under study will fall above and below the average value of the cycle and thus cancel out.
Why 20 years? The average JS synodic cycle is 7253.4668 days long, or 19.858564 years. But because of the eccentricity of the planetary orbits, the value can be approximated as exactly 20 years.

| Author | Hans Hannula |
| Pages | 204 |
| Published Date | 2001 |
Some Pictures From the Book
Gann's Greatest Secret By Dr Hans Hannula


