Articles
Ganns Master Charts Unveiled
Introduction:
W.D. Gann traded for over 50 years. He wrote several trading books as well as a course on commodities and stocks. It was said that he made over $50 million dollars trading the markets with his mathematical techniques. Because of his success, he became the most famous trader of all time.
Most of Gann’s books and courses were written in a veiled language as said by the trading community. What this means is he buried his techniques of trading in his courses. It’s there, but the reader has to read and reread his material several times to get anything of trading value out of it. Gann’s material is extremely complicated and the trader must have a strong background in mathematics to fully benefit from it. Some expert’s think that he did not put in the books and courses what he really traded with, even though the price of the courses was an unbelievable $3,500 at the time he sold them. Converted into today’s prices, it would be equilavalent to $50,000. He kept the good trading secrets for himself or for those few who could afford to pay him the asking price of $100,000.
One of the trading methods that Gann kept to himself was the use of Pythagorean Square. He also kept secret the hexagon and the circle charts. He went to the land of the Pyramids to study the Pythagorean Square to find its secrets. It’s believed that he found someone over there who explained how it worked and how it could be used in the markets.
We know the Gann used the Pythagorean Square because he was found carrying it with him into the trading pit all the time. This square was hidden in the palm of his hand. How did he use this square? Why did he not discuss the use of this square in his courses? There is only one page covering the Square on Nine in all of his books and courses. Was this square his most valuable tool? These and all the other squares Gann used will be discussed in detail in this book with many illustrations and examples to prove how they work. It almost seems that Gann kept the secret of how to use these charts to himself for two reasons: these charts tell the real mysteries behind the market; and if other traders knew how to use these master charts, it might have hurt his trading.

Virtually every big Gann trader of today that we have questioned has said that they use the Square of Nine in their trading in some way. We have questioned many of these traders and have done much research to help you use these valuable master charts of Gann. The master charts we looked at are the Table Charts, the Square of Nine, the Square of Four, the Hexagon Chart and the Circle Charts and others. We produced this book with charts and illustrations on how to use them to help you trade better and smarter in the markets.
Also included in this book are many of the archived articles previously written in the Gann and Elliott Wave and Traders World magazine on the Square of Nine. These articles are included so you can get a different viewpoints from experts in the field.
Gann Master Charts Unveiled tells you how to use these charts to trade the markets. These charts can be used to calculate natural support and resistance for both time and price. They can also be used to calculate seasonal and calendar time points for market changes.
| Author | Larry Jacobs |
| Pages | 99 |
| Published Date | 2000 |
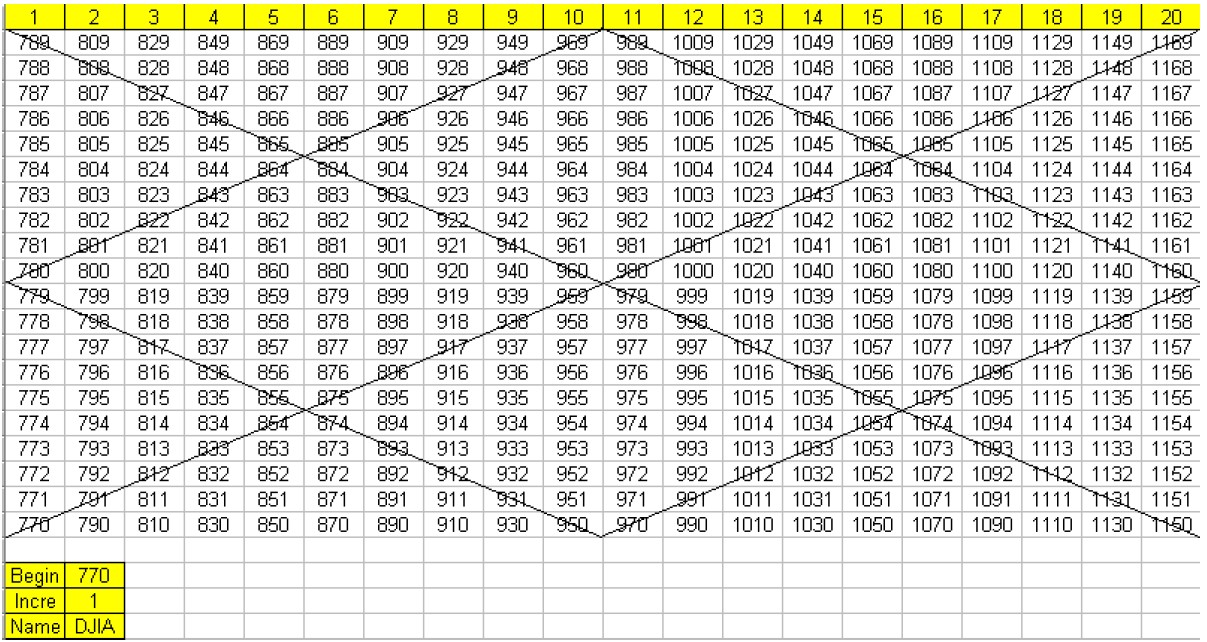
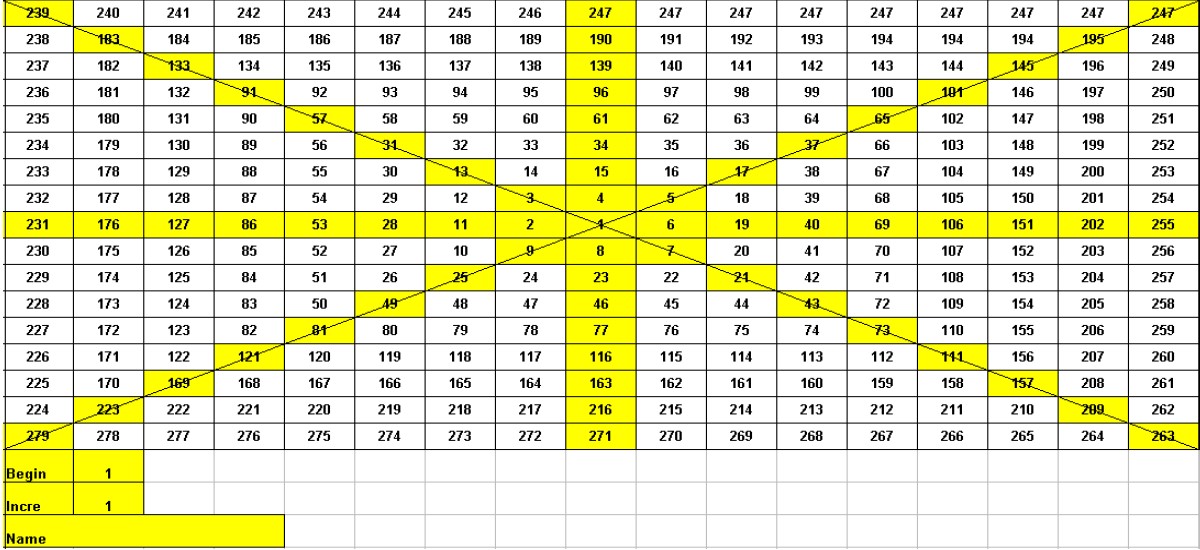
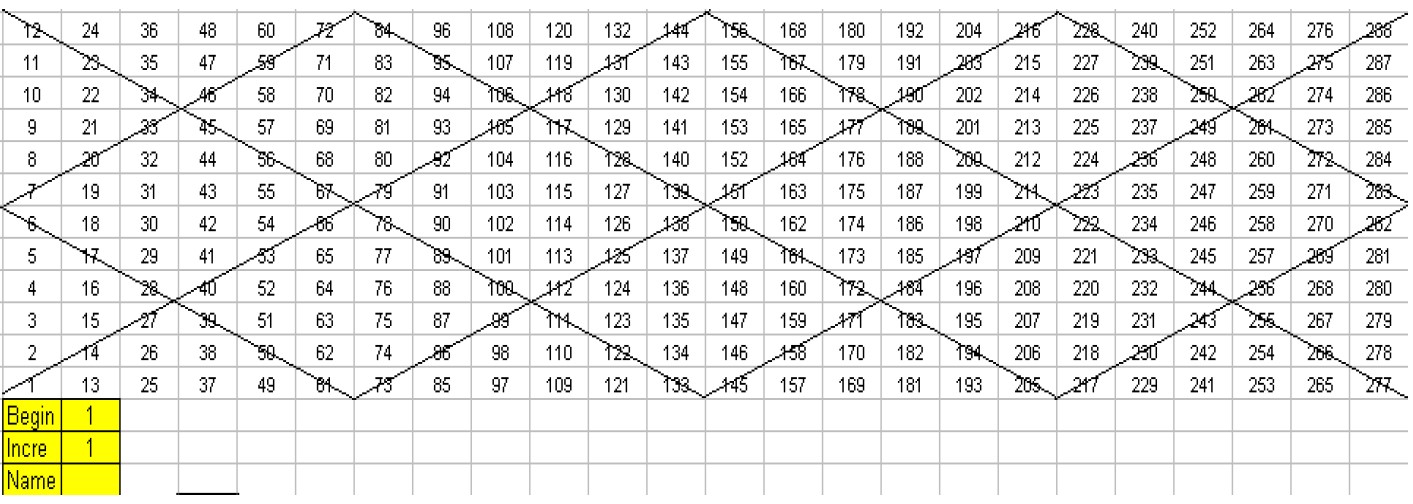
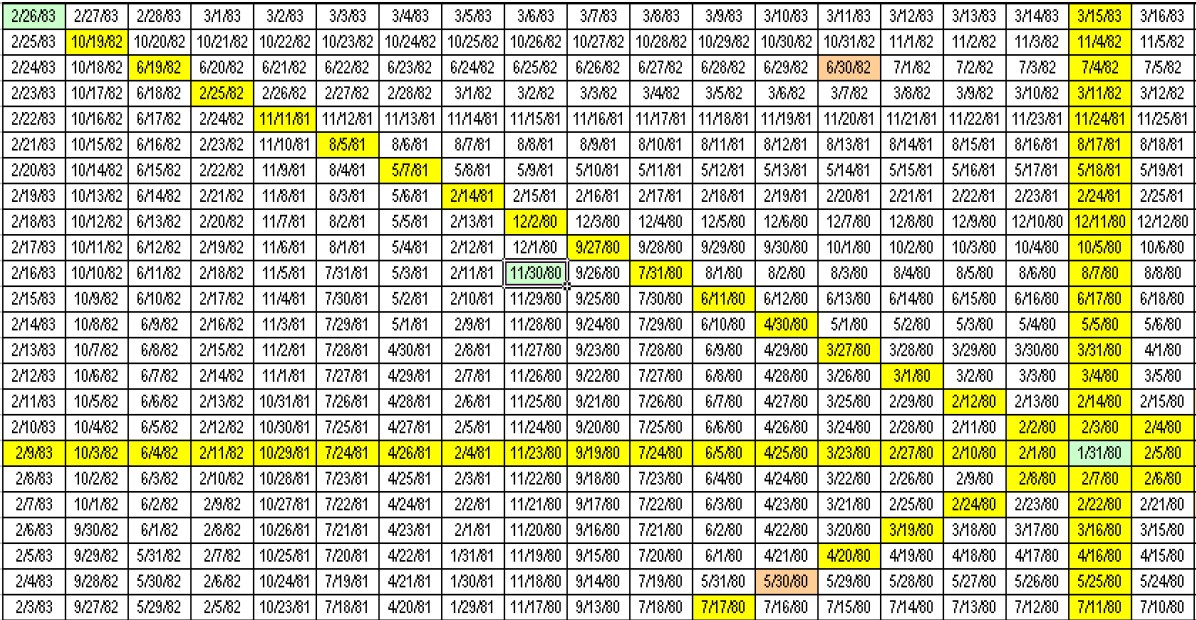
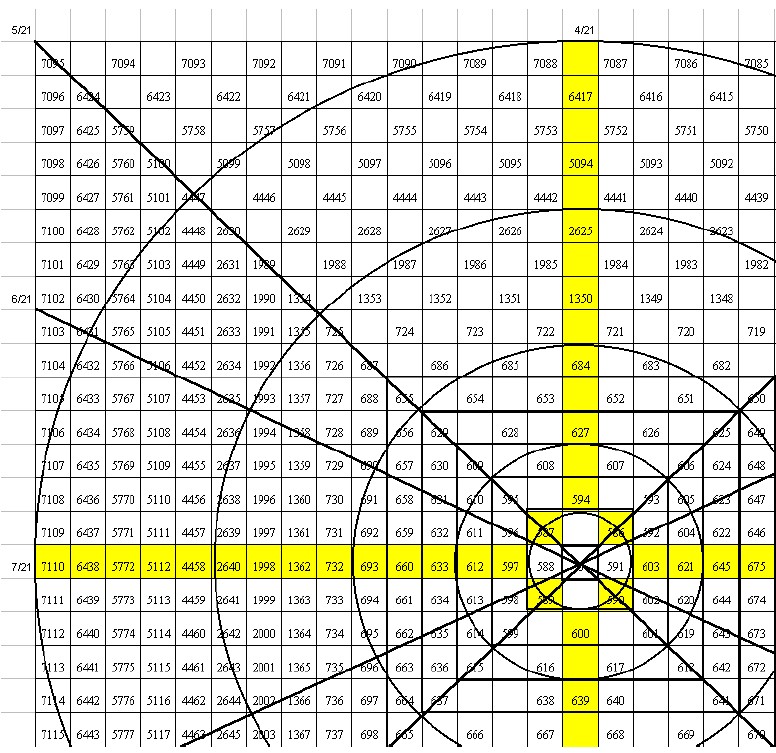
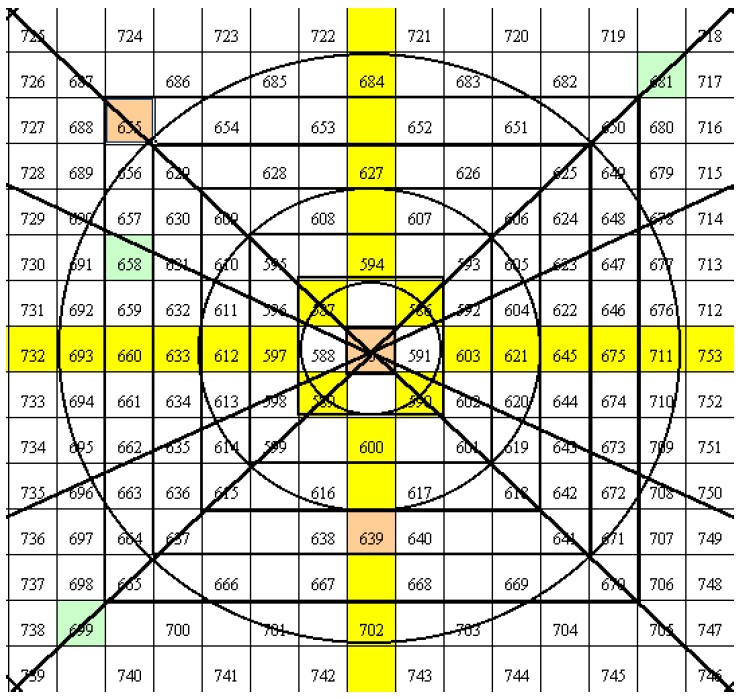
Some Pictures From the Book
Table of Contents:
- Chapter 1 – Table Charts
- Chapter 2 – The Square of Nine
- Chapter 3 – Square of Four
- Chapter 4 – Gann’s Ratio Calculator
- Chapter 5 – Gann’s Hexagon Chart
- Chapter 6 – Circle Charts
- Chapter 7 – Nine Math Points
- Chapter 8 – Time/Price Resistance
Ganns Master Charts Unveiled By Larry Jacobs

